How Do I Measure The ROI Of My Webinars: The 7-Metric Framework That Proves Marketing Impact
Discover the 7-metric framework that transforms webinars from cost centres into proven revenue drivers. Includes ROI formulas, attribution models & dashboard templates.
How Do I Measure The ROI Of My Webinars: The 7-Metric Framework That Proves Marketing Impact
The Big Question Every Marketing Leader Faces
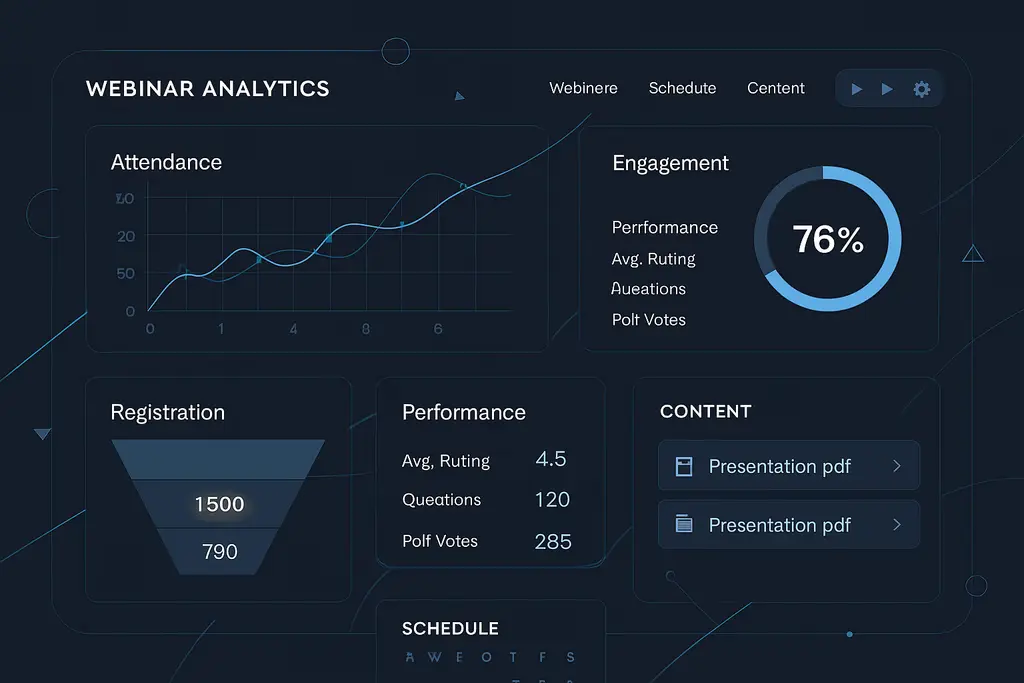
You’ve just presented your quarterly webinar results to the board. The numbers look impressive: 500 registrations, 200 attendees, and a 45% engagement rate. But then comes the inevitable question: “What’s the actual return on investment?” Tracking key performance indicators and key metrics is essential to accurately measure and communicate the value of your webinar efforts.
For 73% of B2B marketing leaders, this moment represents a critical challenge. According to recent research, whilst 95% of marketers consider webinars vital for their strategy, most struggle to demonstrate clear ROI that justifies continued investment. The stakes are high - with average webinar costs ranging from $72 per lead to thousands in production expenses, it’s important to account for both direct costs and the dollar value of resources invested, making proving value more crucial than ever.
This comprehensive guide solves that challenge. You’ll discover a proven 7-metric framework that transforms webinars from cost centres into measurable revenue drivers, complete with calculation formulas, attribution models, and dashboard templates that turn stakeholder scepticism into strategic support. This framework serves as a comprehensive webinar strategy to track key metrics and optimize ROI. Streamlining the registration process can prevent drop-offs from potential attendees, ensuring higher participation rates.
The Hidden Cost of Webinar ROI Blindness
Before diving into solutions, let’s address the elephant in the room: why measuring webinar ROI matters more than ever in 2025. Selecting relevant and engaging topics is crucial for the success of a webinar, as it directly impacts attendance and engagement levels. Understanding audience interests leads to more relevant webinar topics, ensuring higher engagement and satisfaction.
The Strategic Imperative
68% of surveyed marketers can tie webinars to revenue, yet many organisations still treat webinars as nice-to-have marketing activities rather than strategic revenue drivers. This disconnect creates three critical problems: Interactive elements like polls and Q&A sessions greatly enhance engagement in webinars, making them more effective as strategic tools. Live Q&A sessions create a dynamic conversation with attendees, fostering deeper engagement and trust.
Budget Vulnerability: Without clear ROI data, webinar programmes face the first budget cuts during economic uncertainty. Marketing leaders report that unmeasured activities are 3x more likely to lose funding. Sending reminder emails increases attendance rates significantly, helping to ensure that webinars achieve their intended impact. Promotions across multiple channels are necessary to maximize webinar attendance and reach a broader audience.
Resource Misallocation: Teams continue investing in low-performing webinars whilst missing opportunities to scale successful formats. Only 38% of marketers evaluate holistic ROI by measuring traditional and digital marketing together.
Strategic Misalignment: Webinars remain tactical events rather than integral parts of demand generation architecture. This prevents organisations from leveraging webinars’ true potential as pipeline accelerators. To maximise impact, webinars should be integrated into broader webinar strategies and the overall marketing strategy, ensuring data-driven decision-making and continuous optimisation. Engagement metrics, including interactions such as polls, questions, and chat during the webinar, are key to understanding their effectiveness.
The Attribution Challenge
The complexity of B2B buying journeys makes webinar attribution particularly challenging. Consider a typical scenario:
- Prospect downloads an ebook (first touch)
- Attends a webinar three weeks later (middle touch)
- Books a demo after receiving follow-up email (conversion touch)
- Closes deal six months later (revenue attribution)
Drop-off rate tracks when attendees leave or stop engaging with the webinar, helping to identify content that isn’t resonating. Feedback and satisfaction scores are collected through post-webinar surveys sent to attendees, providing valuable insights for improving future sessions.
Which touchpoint deserves credit? Traditional attribution models fail to capture webinars’ multi-faceted impact on deal velocity, pipeline quality, and customer lifetime value.
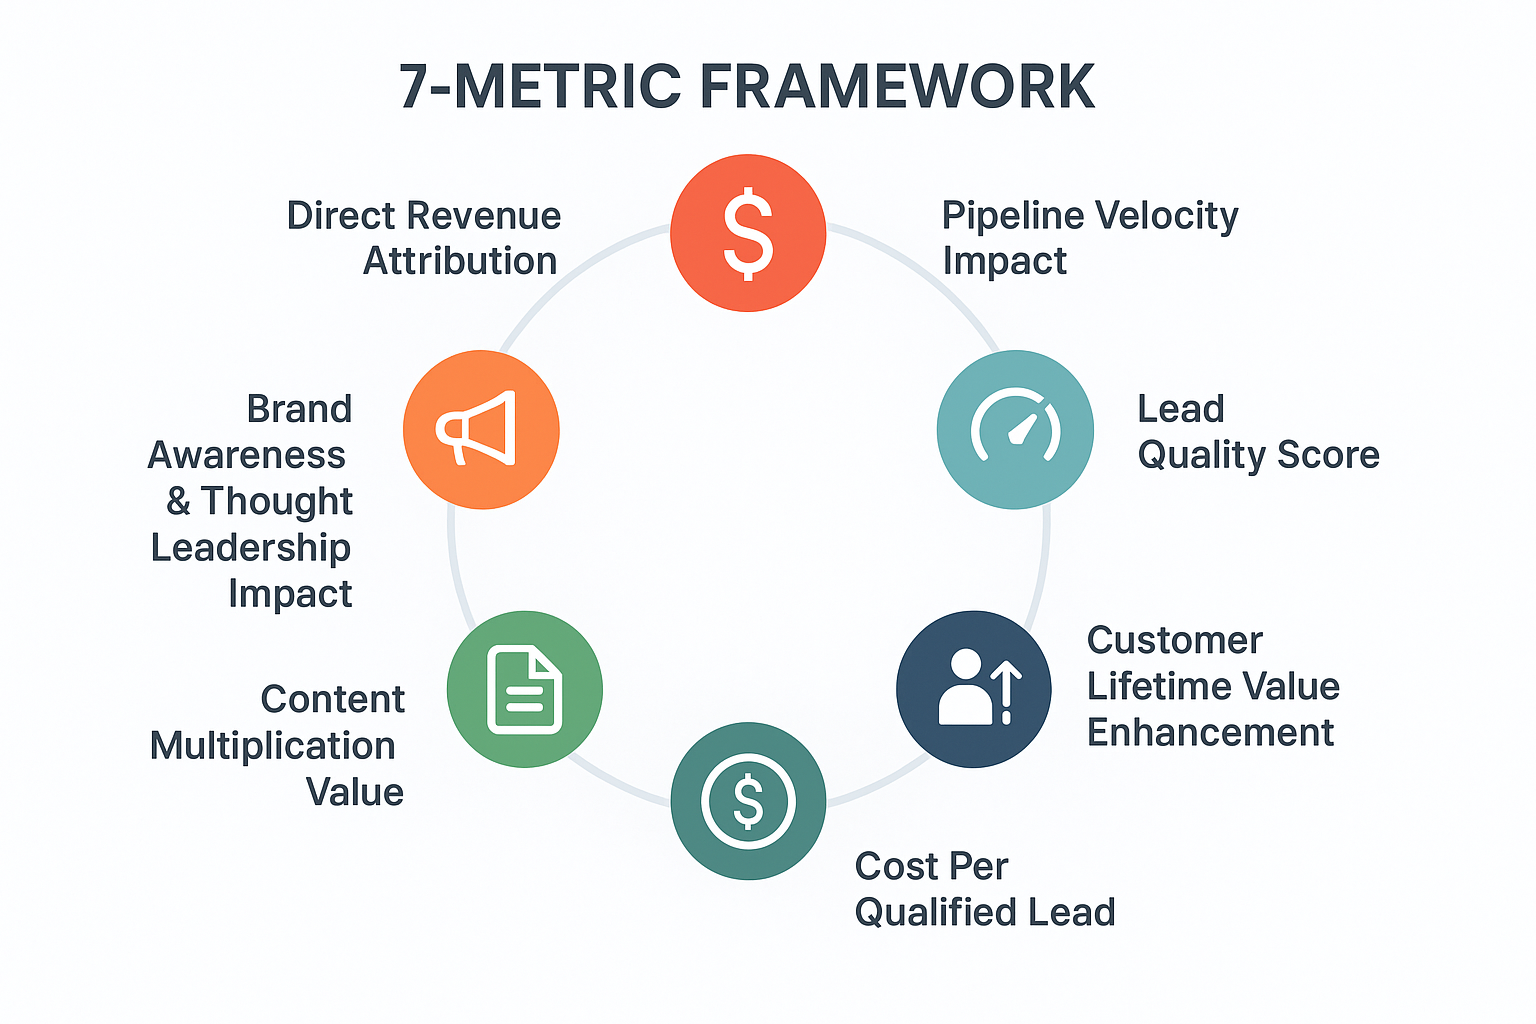
The 7 Key Metrics Framework for Webinar ROI Measurement
Based on analysis of high-performing B2B webinar programmes, this framework provides a comprehensive approach to measuring and proving webinar value. To maximize results, it is crucial to identify the right metrics to measure, including essential metrics and webinar metrics, in order to gather comprehensive data for accurate ROI analysis. Understanding which webinars yield the highest returns allows for more effective budget allocation. Each metric serves a specific purpose in building an unassailable business case. Using a simple registration form encourages higher sign-up completion rates, making it easier to attract participants.
Metric 1: Direct Revenue Attribution
Definition: Revenue directly attributed to webinar attendees within defined timeframes.
Why It Matters: This forms the foundation of your ROI calculation, providing hard numbers that finance teams understand and trust. Tracking revenue generated from webinars is essential for calculating event ROI and demonstrating the financial impact of your marketing efforts.
Calculation Formula:
Measurement Method:
- Track all webinar attendees in your CRM
- Tag them with specific webinar identifiers
- Monitor their progression through your sales funnel
- Calculate revenue closed within 6-12 months post-webinar
Use these steps to accurately calculate webinar ROI by comparing the revenue generated against the costs of hosting the event. Metrics such as conversion rates and revenue generated from webinar leads are essential for analyzing ROI.
Industry Benchmarks: 20% to 40% of webinar attendees enter the sales pipeline as qualified leads, with typical conversion rates from lead to customer at 2%-5%. For more insights, see why your webinars look amateur (and it’s costing you leads).
Pro Tip: Use different attribution windows for different webinar types. Product demos might show results within 30 days, whilst thought leadership webinars may take 6+ months to generate revenue.
Metric 2: Pipeline Velocity Impact
Definition: How webinars accelerate deals through your sales pipeline compared to non-webinar influenced opportunities.
Why It Matters: Webinars often compress sales cycles by providing education, building trust, and addressing objections upfront. This acceleration represents significant hidden value.
Calculation Formula:
Measurement Method:
- Track average days in pipeline for webinar-influenced deals
- Compare against baseline deal velocity
- Calculate time saved per deal
- Multiply by your average sales team cost per day
Expected Results: High-performing webinars can reduce sales cycles by 15-25%, representing thousands in cost savings per closed deal.
Metric 3: Lead Quality Score
Definition: Comparative analysis of lead quality from webinar attendees versus other channels.
Why It Matters: Not all leads are created equal. Webinar leads often demonstrate higher intent and engagement, translating to better conversion rates and customer lifetime value. Webinars are particularly effective for generating qualified leads and generating leads, as they allow you to design content and promotional strategies that specifically attract and capture potential customers, outperforming many other channels in lead generation.
Calculation Formula:
Measurement Method:
- Track conversion rates from webinar leads to customers
- Compare against your baseline lead-to-customer conversion rate
- Calculate the quality multiplier
- Apply to lead volume for true value assessment
- Track the process of generating qualified leads and generating leads through webinars by monitoring engagement levels, content effectiveness, and conversion metrics.
Industry Insight: 73% of B2B webinar attendees become leads, compared to 20-40% for B2C attendees, indicating significantly higher intent levels.
Metric 4: Customer Lifetime Value (CLV) Enhancement
Definition: Increased customer lifetime value from webinar-acquired customers compared to other acquisition channels.
Why It Matters: Webinar-acquired customers often exhibit higher engagement, lower churn rates, and greater expansion potential due to the educational foundation provided. Webinars can also be used to engage existing customers, not just acquire new ones, leading to higher lifetime value through ongoing education and product updates.
Calculation Formula:
Measurement Method
- Calculate average CLV for webinar-acquired customers
- Compare against overall customer base CLV
- Track retention rates and expansion revenue
- Project long-term value differential
Expected Impact: Companies typically see 10-30% higher CLV from webinar-acquired customers due to better product understanding and stronger initial engagement.
Metric 5: Cost Per Qualified Lead (CPQL)
Definition: Total webinar investment divided by qualified leads generated, compared to other marketing channels.
Why It Matters: This metric directly addresses budget allocation decisions and competitive channel analysis.
Calculation Formula:
Measurement Method:
- Calculate total webinar costs (platform, production, promotion, personnel). Be sure to include both direct and indirect costs, such as staff time and overhead, to accurately reflect the total costs of your webinar efforts.
- Track qualified leads generated (not just attendees)
- Compare against other channel CPQLs
- Analyse cost efficiency trends over time
Industry Benchmarks: Average webinar cost per lead is $72, compared to $198 for trade shows and $811 for conferences.
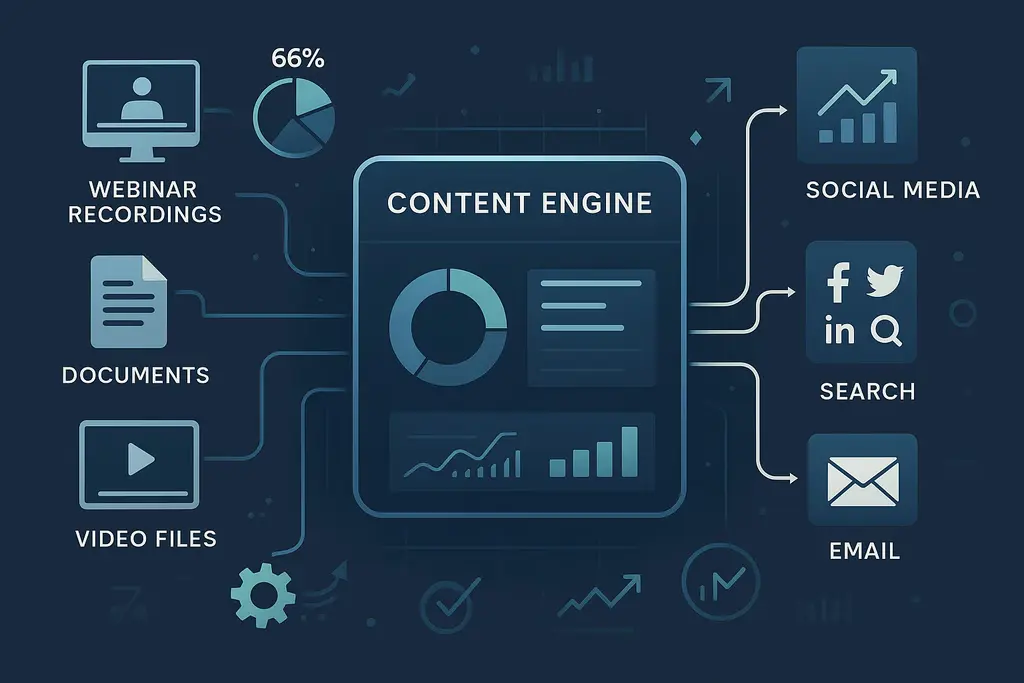
Metric 6: Content Multiplication Value
Definition: Additional value generated from repurposing webinar content, including webinar recordings, across multiple channels and touch points.
Why It Matters: Webinars create substantial content assets that continue generating value long after the live event, significantly improving overall ROI. Webinar recordings extend the lifecycle and accessibility of the webinar, allowing audiences to engage on their own schedule.
Calculation Formula:
Measurement Method:
- Track website traffic from webinar content pages
- Monitor social media engagement from webinar clips
- Measure email performance using webinar content
- Calculate on-demand viewing metrics
- Track engagement with the webinar recording to assess its ongoing value and reach
- Apply your standard value per interaction rate
Webinar platforms often come with built-in analytics to track engagement and performance metrics, making it easier to measure ongoing value.
Expected Results: 65% of marketers repurpose webinar content, with properly executed repurposing strategies generating 3-5x additional value from the original investment. Analyzing repurposed content, including webinar recordings, provides valuable insights that can inform future webinar content and improve overall results.
Metric 7: Brand Awareness and Thought Leadership Impact
Definition: Increased brand recognition, share of voice, and thought leadership positioning attributable to webinar programmes.
Why It Matters: Whilst harder to quantify, brand building represents significant long-term value that supports all other marketing activities. Increased brand awareness and thought leadership from webinars directly contribute to business growth by expanding your audience, building trust, and driving future sales or conversions.
Calculation Formula:
Measurement Method:
- Track brand mentions and sentiment pre/post webinar
- Monitor industry share of voice metrics
- Measure thought leadership engagement (downloads, citations, invitations)
- Survey attendees about brand perception changes
- Apply your organisation’s brand value multiplier
Measurement Tools: Google Alerts, Brand24, Mention, BuzzSumo for quantitative tracking; post-webinar surveys for qualitative insights.
Attribution Models: Choosing Your Approach
The attribution model you select profoundly impacts your ROI calculations. Tracking webinar ROI and tracking ROI in general are essential for evaluating webinar success, as they help you measure the effectiveness of your efforts and choose the most suitable attribution model. Here’s how to choose the right approach for your organisation:
Single-Touch Attribution Models
First-Touch Attribution: Credits the entire deal value to the first interaction, often the webinar registration or attendance.
Pros: Simple to implement, highlights top-of-funnel impact Cons: Ignores nurturing efforts, oversimplifies complex B2B journeys Best For: Organisations with short sales cycles or webinar-heavy acquisition strategies
Last-Touch Attribution: Assigns full credit to the final interaction before purchase.
Pros: Easy to track, emphasises conversion activities Cons: Undervalues early-stage activities like webinars Best For: Businesses with clear conversion events and simple buyer journeys
Multi-Touch Attribution Models
Linear Attribution: Distributes credit equally across all touch points in the buyer journey.
Pros: Recognises all interactions, simple to understand Cons: Doesn’t account for varying touchpoint importance Best For: Organisations wanting to value all marketing activities equally
Time-Decay Attribution: Gives more credit to interactions closer to the conversion event.
Pros: Reflects recency bias in decision-making Cons: May undervalue early-stage education like webinars Best For: Shorter sales cycles with clear conversion moments
W-Shaped Attribution: Allocates 30% credit each to first touch, lead conversion, and opportunity creation, with remaining 10% distributed among other touch points.
Pros: Balances acquisition, nurturing, and conversion activities Cons: Complex to implement, requires sophisticated tracking Best For: Mature B2B organisations with clear funnel stages
Recommended Approach for Webinars
For most B2B organisations, we recommend a custom multi-touch model that gives extra weight to webinar interactions:
- First Touch: 20% (often a webinar registration)
- Webinar Attendance: 25% (education and engagement)
- Lead Conversion: 25% (MQL creation)
- Opportunity Creation: 20% (sales qualified lead)
- Other Touch points: 10% (distributed proportionally)
This approach recognises webinars’ unique role in education and trust-building whilst maintaining balanced attribution across the funnel. By using a custom multi-touch attribution model, you gain a more accurate picture of your webinar’s effectiveness, allowing you to measure and optimize performance based on real engagement and conversion data.
Dashboard Setup: Your ROI Command Centre
Creating an effective webinar ROI dashboard requires careful planning and the right visualisation approach. To maximize your results, it’s essential to use webinar platforms that offer detailed analytics and comprehensive data, ensuring you have all the insights needed for effective dashboard setup. Here’s your step-by-step setup guide:
Essential Dashboard Components
Executive Summary Panel
- Overall webinar programme ROI
- Total revenue attributed
- Cost per qualified lead
- Pipeline velocity impact
- Key metrics overview for webinar performance
Performance Trends
- Monthly ROI trends
- Lead quality comparisons
- Attendance vs. conversion rates
- Cost efficiency improvements
- Tracking key metrics such as attendance, engagement, and ROI over time
Individual Webinar Performance
- Top-performing webinars by ROI
- Conversion rates by webinar type
- Audience engagement metrics
- Follow-up campaign effectiveness
- Evaluation of key metrics for each webinar
Competitive Analysis
- Channel performance comparison
- Cost per lead benchmarking
- Quality score comparisons
- Attribution analysis
Data Integration Requirements
CRM Integration: Connect HubSpot, Salesforce, or your preferred CRM to track lead progression and revenue attribution.
Marketing Automation: Integrate with Marketo, Pardot, or HubSpot to track nurturing sequences and campaign performance.
Webinar Platform: Connect your webinar software (Zoom, GoToWebinar, or ON24) for attendance and engagement data.
To accurately measure ROI, it is essential to gather comprehensive data from all integrated sources, ensuring you capture every relevant metric.
Financial Systems: Link to your accounting software for accurate cost tracking and ROI calculations.
Recommended Dashboard Tools
For Beginners: HubSpot’s built-in reporting provides excellent basic ROI tracking with easy CRM integration.
For Intermediate Users: Tableau or Power BI offer more sophisticated visualisation options with custom calculation capabilities.
For Advanced Users: Custom solutions using tools like Sisense or Looker provide maximum flexibility and advanced attribution modelling.
Dashboard Best Practices
Update Frequency: Refresh data weekly for tactical decisions, monthly for strategic planning.
Stakeholder Customisation: Create different views for executives (summary metrics), marketing managers (detailed performance), and finance teams (cost analysis).
Benchmarking: Include industry benchmarks and historical performance for context.
Actionable Insights: Highlight areas requiring attention with automated alerts and recommendations, ensuring dashboards support data driven decisions for webinar optimization.
Common Pitfalls and How to Avoid Them
Even well-intentioned teams make critical mistakes when measuring webinar ROI. One common risk is failing to regularly review and optimize your webinar format, which can lead to missed opportunities for better engagement and retention. Feedback collected through post-webinar surveys provides insights for future improvements. Here are the most common pitfalls and proven solutions:
Pitfall 1: Vanity Metrics Focus
The Problem: Measuring registrations and attendance without connecting to business outcomes.
The Solution: Always tie metrics to revenue or pipeline impact. A webinar with 50 highly qualified attendees outperforms one with 500 disengaged participants. Focus on essential metrics that truly reflect webinar success and ROI, rather than vanity metrics.
Implementation: Create a weighted scoring system that prioritises qualified leads over raw attendance numbers.
Pitfall 2: Attribution Window Confusion
The Problem: Using inconsistent or inappropriate attribution windows across different webinar types.
The Solution: Establish clear attribution windows based on your average sales cycle length and webinar objectives.
Implementation:
- Product demos: 30-90 days
- Thought leadership: 6-12 months
- Customer education: 3-6 months
Pitfall 3: Ignoring Indirect Value
The Problem: Focusing only on direct revenue attribution whilst missing content multiplication and brand building benefits.
The Solution: Develop a comprehensive value framework that includes all webinar benefits, both direct and indirect.
Implementation: Calculate content repurposing value, brand awareness impact, and customer education benefits using the metrics outlined above. Be sure to account for indirect costs, such as staff time and overhead, when analyzing webinar ROI to ensure a more accurate and comprehensive assessment.
Pitfall 4: Inconsistent Cost Calculations
The Problem: Using different cost calculation methods across webinars or excluding hidden costs.
The Solution: Standardise your cost calculation methodology and include all associated expenses.
Implementation: Create a cost template that includes:
- Platform fees
- Production costs
- Personnel time
- Promotion expenses
- Opportunity costs
- Overhead allocation
Make sure to include all direct costs, such as platform and speaker fees, in your template to ensure accurate and consistent cost tracking.
Pitfall 5: Technology Limitations
The Problem: Using inadequate tracking systems that can’t provide accurate attribution data.
The Solution: Invest in proper marketing technology stack with robust tracking capabilities. Choose technology that offers detailed analytics to accurately measure webinar performance and optimize engagement strategies.
Implementation: Ensure your CRM, marketing automation, and analytics tools can track complete customer journeys from webinar registration through purchase.
Advanced ROI Optimisation Strategies
Once you’ve mastered basic ROI measurement, these advanced strategies can significantly improve your webinar programme’s performance. By leveraging data-driven insights, you can improve future webinars and future events through enhanced content, engagement tactics, and technical execution.
Applying these advanced measurement techniques not only boosts your current results but also provides valuable insights to plan and optimize future webinars for even greater success.
Predictive ROI Modeling
Use historical data to predict future webinar performance and optimise resource allocation.
Implementation Steps:
- Analyse historical webinar data to identify performance patterns
- Create predictive models based on topic, timing, and audience factors
- Test predictions against actual results
- Refine models based on accuracy feedback
Expected Benefits: 20-30% improvement in ROI through better topic selection and resource allocation. Predictive modeling also provides valuable insights that can inform and optimize future marketing campaigns.
Dynamic Pricing Models
Adjust webinar investment based on predicted ROI rather than using fixed budgets.
Implementation Steps:
- Establish ROI thresholds for different webinar types
- Create investment guidelines based on expected returns
- Implement dynamic budget allocation based on performance predictions
- Monitor and adjust based on actual results
Expected Benefits: 15-25% improvement in overall programme ROI through optimised resource allocation.
Cohort Analysis
Track different attendee groups over time to understand long-term value patterns and analyze attendee behavior, such as engagement metrics, drop-off points, and interaction patterns.
Implementation Steps:
- Group attendees by webinar date, topic, or characteristics
- Track cohort performance and attendee behavior over extended periods
- Identify patterns in customer lifetime value and participant involvement
- Adjust strategies based on cohort and attendee behavior insights
Expected Benefits: Better understanding of long-term value, improved customer acquisition strategies, and the ability to optimize future webinars by identifying content issues through attendee behavior analysis.
A/B Testing Framework
Systematically test different webinar elements to optimise ROI. Using polls can enhance engagement by keeping the audience focused.
Testing Variables:
- Webinar length and format
- Follow-up sequence timing
- Call-to-action placement
- Promotional strategies
- Content depth and style
- Interactive elements
- Interactive tools
Testing Variables:
- Webinar length and format
- Follow-up sequence timing
- Call-to-action placement
- Promotional strategies
- Content depth and style
- Interactive elements
- Interactive tools
Implementation Steps:
- Identify high-impact variables to test
- Create controlled testing environments
- Measure results using your ROI framework
- Implement winning variations
- Continue iterative improvement
Expected Benefits: 10-20% improvement in conversion rates through systematic optimisation. Optimizing interactive elements and interactive tools can help keep the audience engaged, leading to better participation and higher ROI.
Building Stakeholder Buy-In
Presenting ROI data effectively is crucial for maintaining programme support and securing additional investment. Clearly communicating webinar success to stakeholders—by defining and measuring key metrics such as registration, attendance, engagement, and ROI—ensures everyone understands the value and effectiveness of your efforts.
Executive Presentation Strategy
Lead with Bottom-Line Impact: Start presentations with total revenue attribution and clear ROI percentages.
Provide Context: Compare webinar performance to other marketing channels and industry benchmarks.
Show Trends: Demonstrate improvement over time and projected future performance.
Address Concerns: Anticipate questions about attribution accuracy and methodology.
Sample Executive Summary
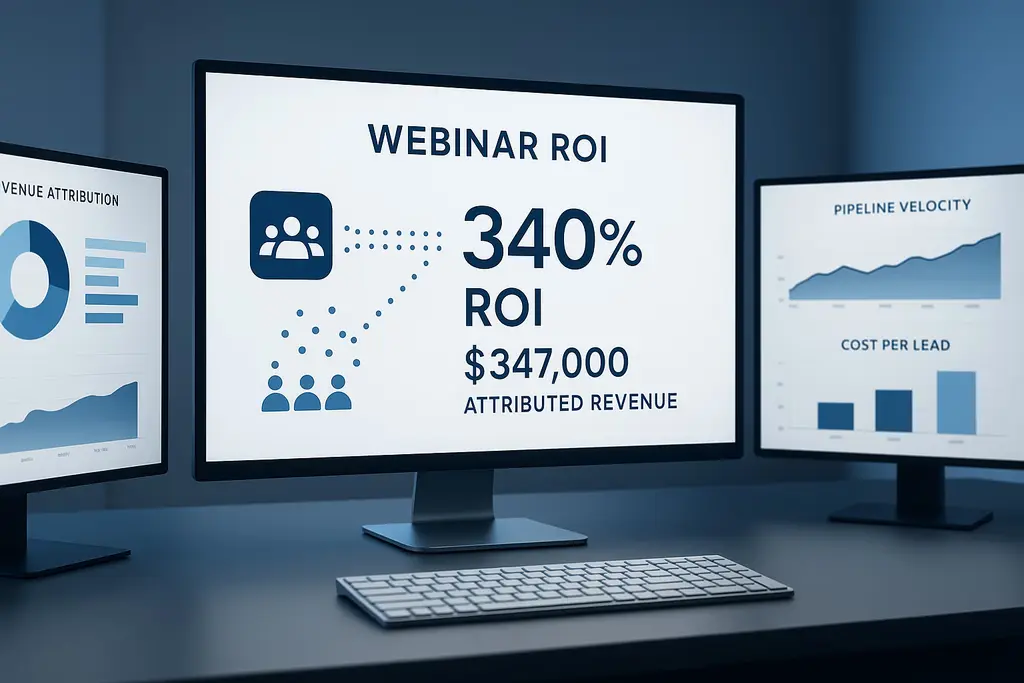
“Our webinar programme generated $347,000 in attributed revenue during Q4 2024, representing a 340% ROI on our $102,000 investment. Webinar-influenced deals closed 23% faster than average, and attendees showed 28% higher customer lifetime value. Cost per qualified lead was $72, compared to $198 for trade shows and $811 for conferences.”
Ongoing Stakeholder Engagement
Monthly Updates: Provide brief performance summaries highlighting key wins and improvements.
Quarterly Reviews: Conduct detailed analysis sessions with key stakeholders to review strategy and resource allocation.
Annual Planning: Use ROI data to inform budget allocation and strategic planning decisions.
The Future of Webinar ROI Measurement
As we look toward 2025 and beyond, several trends will shape how organisations measure and optimise webinar ROI. Tracking metrics such as registered attendees, attendance rate, and attendance rates will become increasingly important for understanding and improving webinar performance.
One emerging trend is the focus on how many attendees engage with the webinar landing page. Analysing the effectiveness of the webinar landing in attracting sign-ups and driving conversions can provide deeper insights into what motivates participation and how to optimise registration rates.
AI-Powered Attribution
Machine learning algorithms will provide more sophisticated attribution modeling, better accounting for complex B2B buyer journeys.
Real-Time Optimisation
Advanced analytics will enable real-time webinar adjustments based on engagement patterns and predicted outcomes.
Integrated Customer Experience
Webinar ROI measurement will become part of comprehensive customer experience analytics, tracking impact across all touch points.
Predictive Engagement
AI will predict which prospects are most likely to benefit from webinar invitations, improving efficiency and ROI.
Taking Action: Your Next Steps
Implementing this ROI framework requires a systematic approach and commitment to measurement discipline. Running webinars effectively involves not only hosting the events but also planning, measuring, and optimizing their performance to maximize engagement and return on investment. Here’s your action plan:
Week 1: Foundation Setup
- Audit current tracking capabilities
- Identify data integration requirements
- Select attribution model
- Begin stakeholder alignment conversations
Week 2-3: Dashboard Development
- Design dashboard layout and metrics
- Integrate data sources
- Create automated reporting
- Test accuracy and completeness
Week 4: Team Training
- Train marketing team on new metrics
- Align sales team on attribution methodology
- Establish reporting schedules
- Create documentation and processes
Month 2: Initial Measurement
- Implement tracking for new webinars
- Gather baseline data
- Identify improvement opportunities
- Refine measurement approach
Month 3: Optimisation
- Analyse performance patterns
- Implement A/B testing programme
- Optimise based on ROI insights
- Scale successful formats
Ongoing: Continuous Improvement
- Monthly performance reviews
- Quarterly strategy adjustments
- Annual measurement methodology review
- Stakeholder reporting and feedback
Conclusion: From Cost Centre to Revenue Driver
The transformation from webinar cost centre to proven revenue driver requires more than good intentions - it demands systematic measurement, clear attribution, and stakeholder alignment. This 7-metric framework provides the foundation for demonstrating webinar value, optimising performance, and securing continued investment.
Remember that ROI measurement is not a destination but a journey. Start with the metrics most relevant to your organisation, gradually expand your measurement capabilities, and continuously refine your approach based on stakeholder feedback and business requirements.
The organisations that master webinar ROI measurement will not only survive budget scrutiny but thrive through strategic investment in this powerful marketing channel. Your webinars can become the cornerstone of demand generation strategy - but only if you can prove their value through disciplined measurement and clear reporting.
Ready to transform your webinar programme from cost centre to revenue driver? The measurement framework is in place. The only question remaining is: when will you begin implementation?
For marketing leaders seeking to accelerate this transformation, consider partnering with specialists who understand both the strategic imperative and tactical execution required. helps B2B SaaS companies implement comprehensive webinar ROI measurement whilst handling the complex production and repurposing that maximises programme value. Free webinars are preferred by audiences because they are typically free of charge, making them an attractive option for driving attendance. When every webinar becomes a measurable asset in your demand generation engine, the return on investment speaks for itself.